
Psychrometrics
The psychrometric chart is an incredibly useful tool that illustrates the relationship between the following:
· Dry Bulb Temperature
· Wet Bulb Temperature
· Dew Point
· Relative Humidity
· Enthalpy
· Humidity Ratio
Dry Bulb Temperature (°F) is the true air temperature, unaffected by radiation or humidity.
Wet Bulb Temperature (°F) is the lowest temperature a parcel of water can reach if it undergoes the maximum possible evaporation. This is usually measured by using a “spin hygrometer.” This involves using a thermometer that is attached to a spinning handle. On the end of the thermometer, where the temperature reading takes place, a wet piece of cloth is placed. The thermometer is spun around and around, forcing the water in the cloth to evaporate. The temperature reading of the thermometer is the wet bulb temperature.
Dew Point (°F) is the temperature to which air must be cooled in order to reach 100% relative humidity.
Relative Humidity (%) is the ratio of the current amount of water vapor present in a parcel of air to the maximum allowable amount of water vapor in the air given the air temperature. At hotter temperatures, air can hold more water. If air is at 100% relative humidity and water is added to the air in the form of evaporation, it will immediately condense back into water.
Enthalpy (BTU / lb) is the total heat energy of a parcel of air. The enthalpy of air will depend on its dry bulb temperature and relative humidity.
Humidity Ratio (grains / lb) is the ratio of the mass of water vapor present in a parcel of air to the mass of the dry air. This is not the same as relative humidity.
Now that we have discussed what each of these terms means, let’s walkthrough the psychrometric chart itself to see how they all relate to each other.
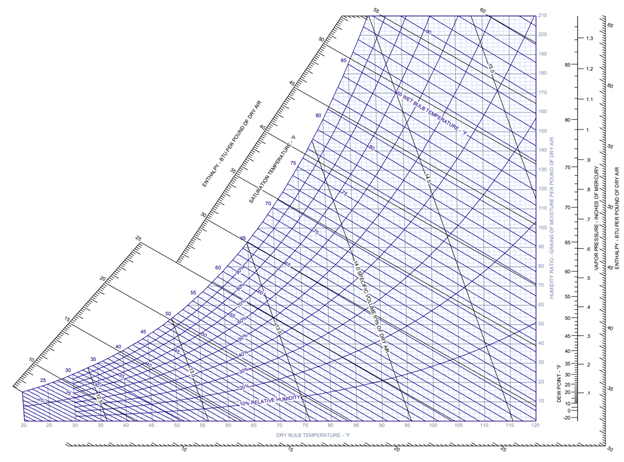
The vertical lines, highlighted in red, are the dry bulb temperatures.
The lines up and to the left, highlighted in green, are the wet bulb temperatures.
The horizontal lines to the left, highlighted in orange, are the dew points.
The curved lines, highlighted in blue, are the relative humidities.
The lines up and to the left, past the wet bulb temperatures and highlighted in purple, are the enthalpies.
And the horizontal lines to the right, highlighted in pink, are the humidity ratios.
All you need is two data points in order to find the rest. For example, as seen on the chart below, we are given a dry bulb temperature of 80 °F and a relative humidity of 50%. Then we plot the point where they intersect (black). We use that point and the directions listed above to find the remaining data:

· Dry Bulb Temperature = 80 °F (Given)
· Wet Bulb Temperature ≈ 66 °F
· Dew Point ≈ 60 °F
· Relative Humidity = 50% (Given)
· Enthalpy ≈ 31.5 BTU/lb
· Humidity Ratio ≈ 78 grains/lb